 Help Center
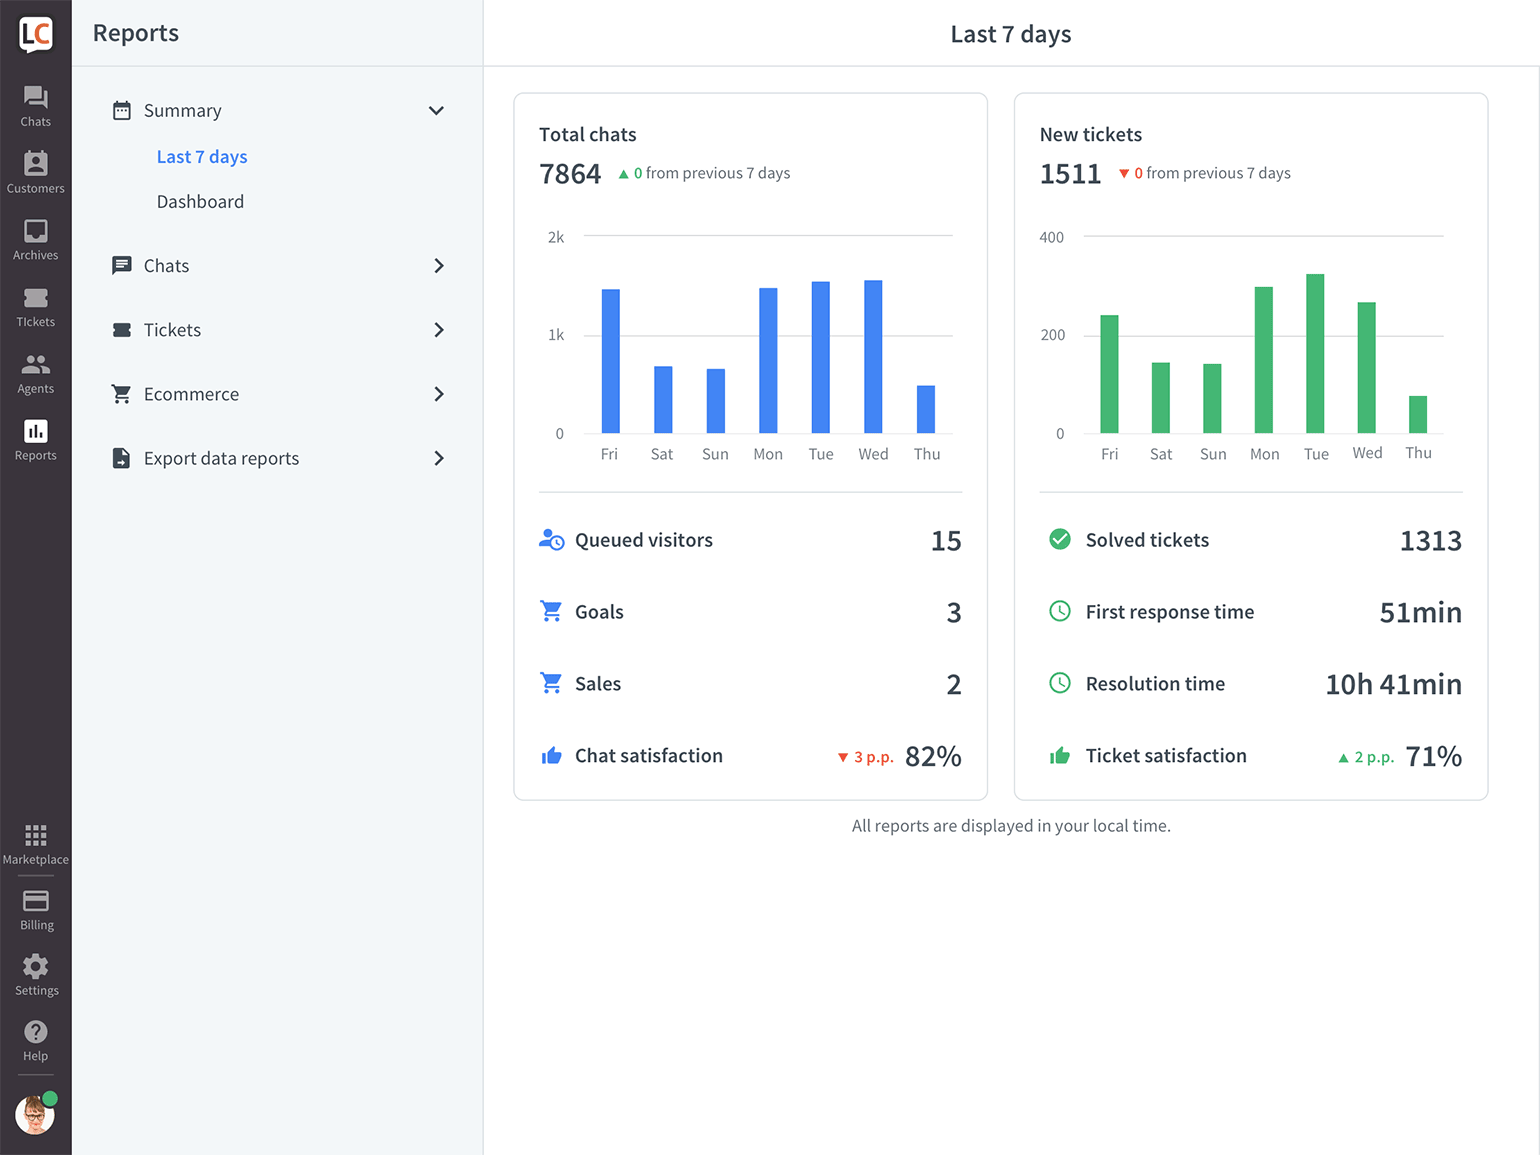
The last 7 days report gives you an overview of the most important LiveChat metrics. It is a good starting point for a weekly or daily evaluation of your customer support team.
This report is available on plans: Team, Business, and Enterprise. Want to try out a different plan before upgrading? Talk to our customer support.
There are two sections, each presenting data about either chats or tickets. When you click on a metric, a full report view appears.
Chats
- Total chats—shows the total number of chats this week. Check how it compares to the number of chats from the previous 7 days. Look at the bar chart to see how the numbers distributed on particular days of the week.
- Queued visitors—shows the total number of customers who were in the queue during the week. Make sure that the number of queued visitors isn’t getting too high. If it is, you should consider adding more agents online.
- Goals—shows how many goals you and your agents achieved with LiveChat. Set up Goals to automatically see how many chats ended with a needed result, e.g., a positive rating.
- Sales—see how many sales were accomplished with LiveChat. You can turn on the Sales Tracker, so each successful transactions shows in LiveChat reports.
- Chat satisfaction—shows the percentage of chats that were rated positively. Keep track of this metric to ensure high customer satisfaction.
Tickets
- New tickets—shows the total number of tickets (coming from support email and ticket form) this week. Check how it compares to the number of tickets from the previous 7 days. Look at the bar chart to see how the numbers distributed on particular days of the week.
- Solved tickets—shows how many tickets agents solved this week. Make sure your agents take care of tickets daily, so they don’t pile up.
- First response time—shows average time it takes your agents to answer for the first time. The lower it is, the happier your customers are—as no one likes to wait.
- Resolution time—shows the average time it takes for your agents to solve a case. As with first response time—the lower, the better.
- Ticket satisfaction—shows the percentage of tickets that were rated positively. Your customers get a follow-up email that lets them rate the agent. It is sent 24h after the case was resolved.
For more in-depth look at you customer service, you can check out individual reports. You can also use the export feature to track even more metrics.