 Help Center
If your customers can contact you through many channels, it's easy to get snowed under with tickets and run late with replies. That's where ticket reports come in handy. Use them to check if your team is on top of their tickets goals.
New tickets report
The new tickets report shows the total number of tickets you got during a given period. It's useful to keep an eye on this report to see how your agents' workload changes.
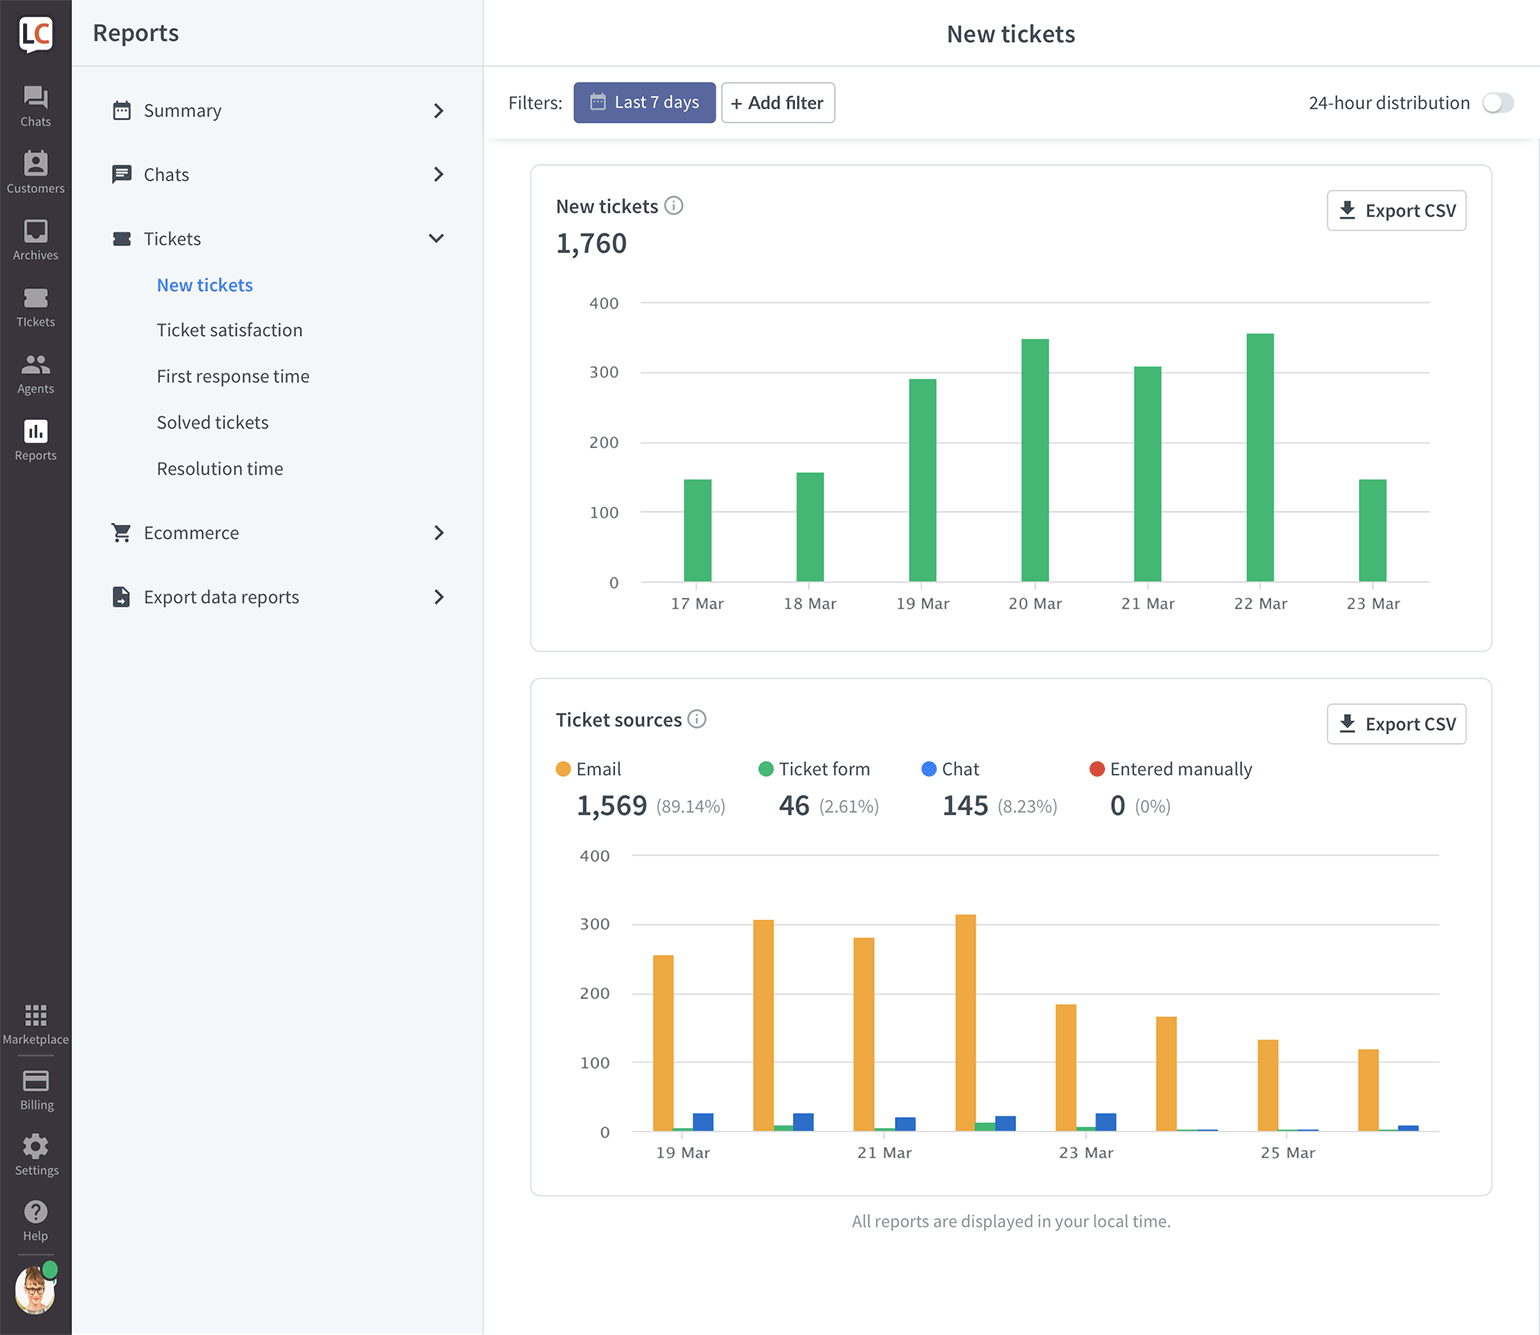
The more customers you have, the more tickets you get, which in time could mean that you should increase the number of agents. Or you could create self-help articles with KnowledgeBase so customers can solve easier cases by themselves.
A sudden increase in the number of tickets could mean that there is something your customers aren't happy about. In that situation, click on one of the columns in the chart to see the tickets from that particular time. You can review them manually to see what happened in detail.
Ticket sources
The 'ticket sources' chart shows how many of your tickets:
- come from email
- come from the ticket form
- are created in a chat
- are entered manually
Each source is represented by a bar in a different color. You can click on any bar to view the tickets coming from that particular source.
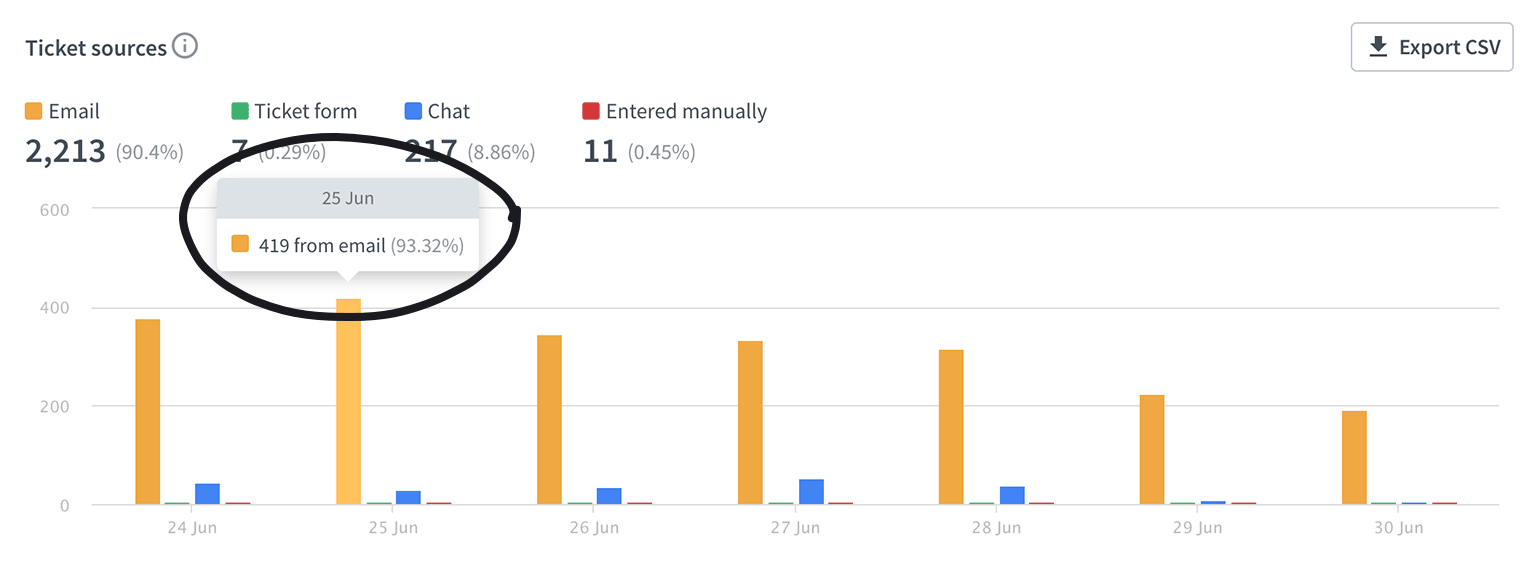
If a lot come from the ticket form, it might mean that you're making your customers wait a long time for a reply. In that case, you should consider extending your online hours.
Learn more about the ticket form.
Learn how to set up email forwarding.
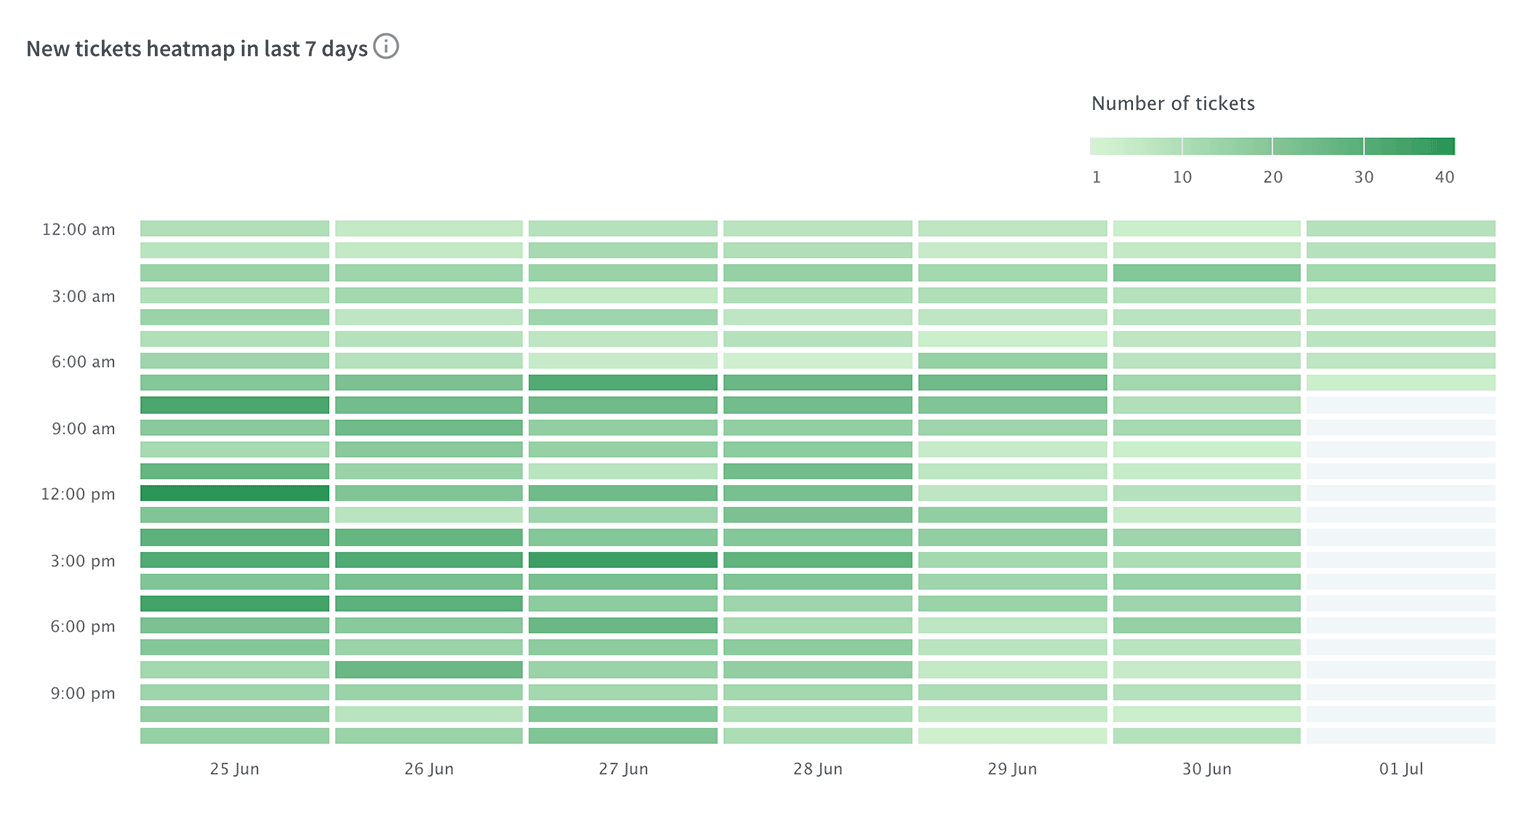
New tickets heatmap
The heatmap is a great extension to the 'new tickets' and 'ticket sources' reports. As it shows the time of day when you get the most tickets. It makes planning shifts and distributing tasks easier, as you know the amount of work you should expect.
Ticket satisfaction report
The report shows the number of both good and bad ratings on particular dates as well as the overall satisfaction of your customers.
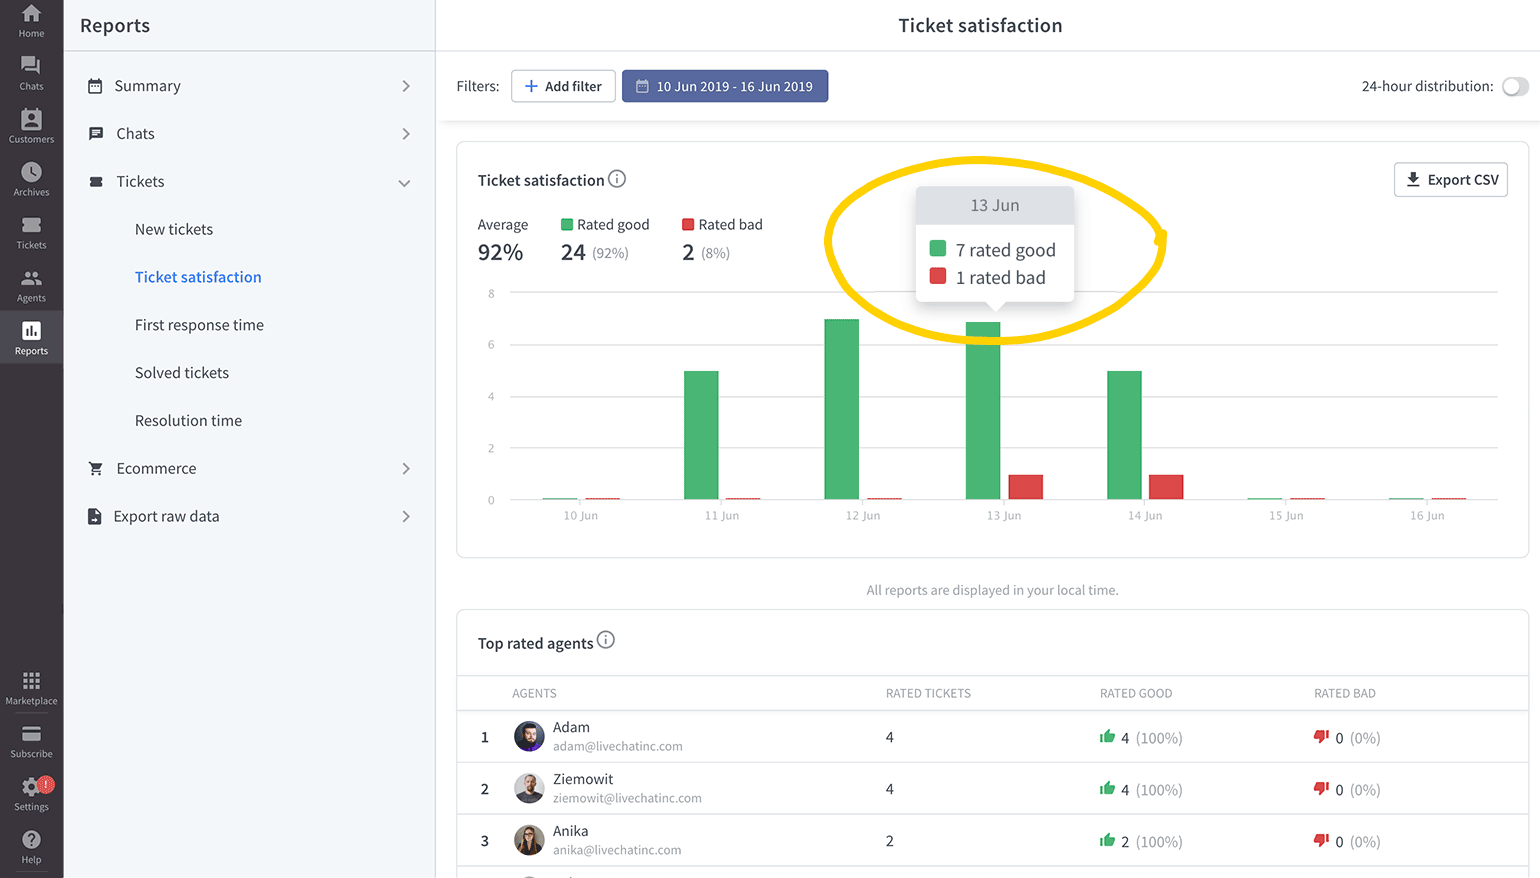
To evaluate particular tickets that were rated as bad, click on the red bar representing a specific date. You will be taken to Tickets where you can check the cases one by one. You can view tickets with a positive rating in the same way.
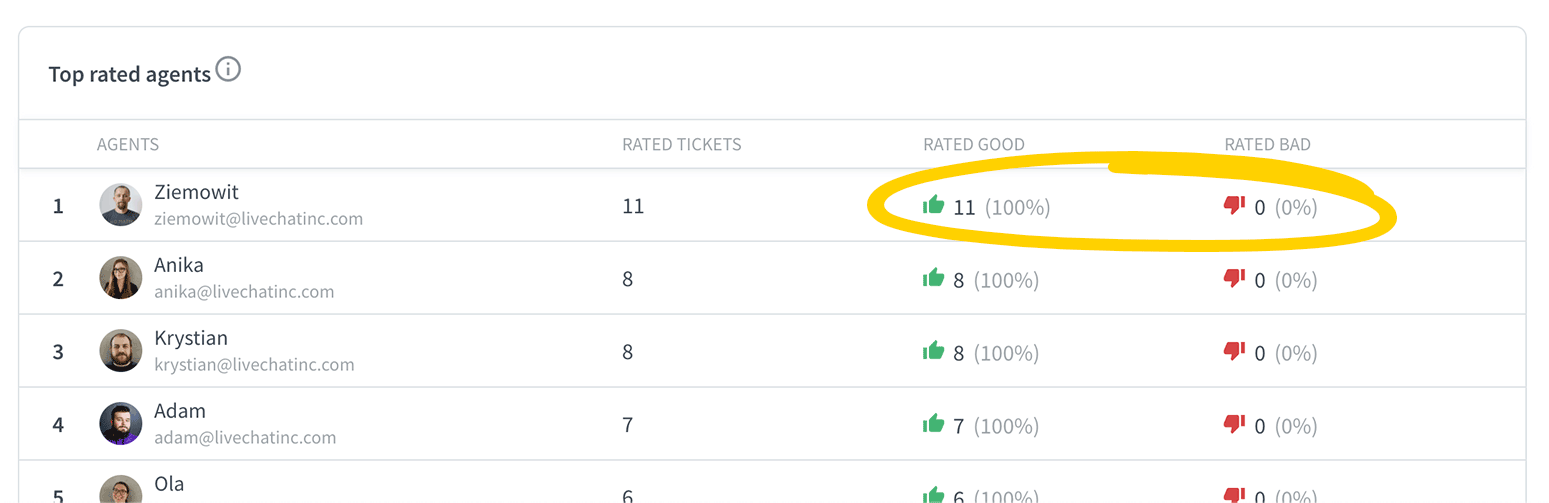
The report also shows a list of your top agents. You can see the number of good and bad ratings for each agent.
How ticket ratings work
Ticket requesters get a chance to rate their experience 24 hours after the ticket has been marked as solved. Just like chats, tickets can be rated either as good or bad. The 24-hour delay is added in case the customer needs to reopen the ticket.
Ticket rating request is enabled by default. To disable it, go to the Ticket settings and uncheck the box.
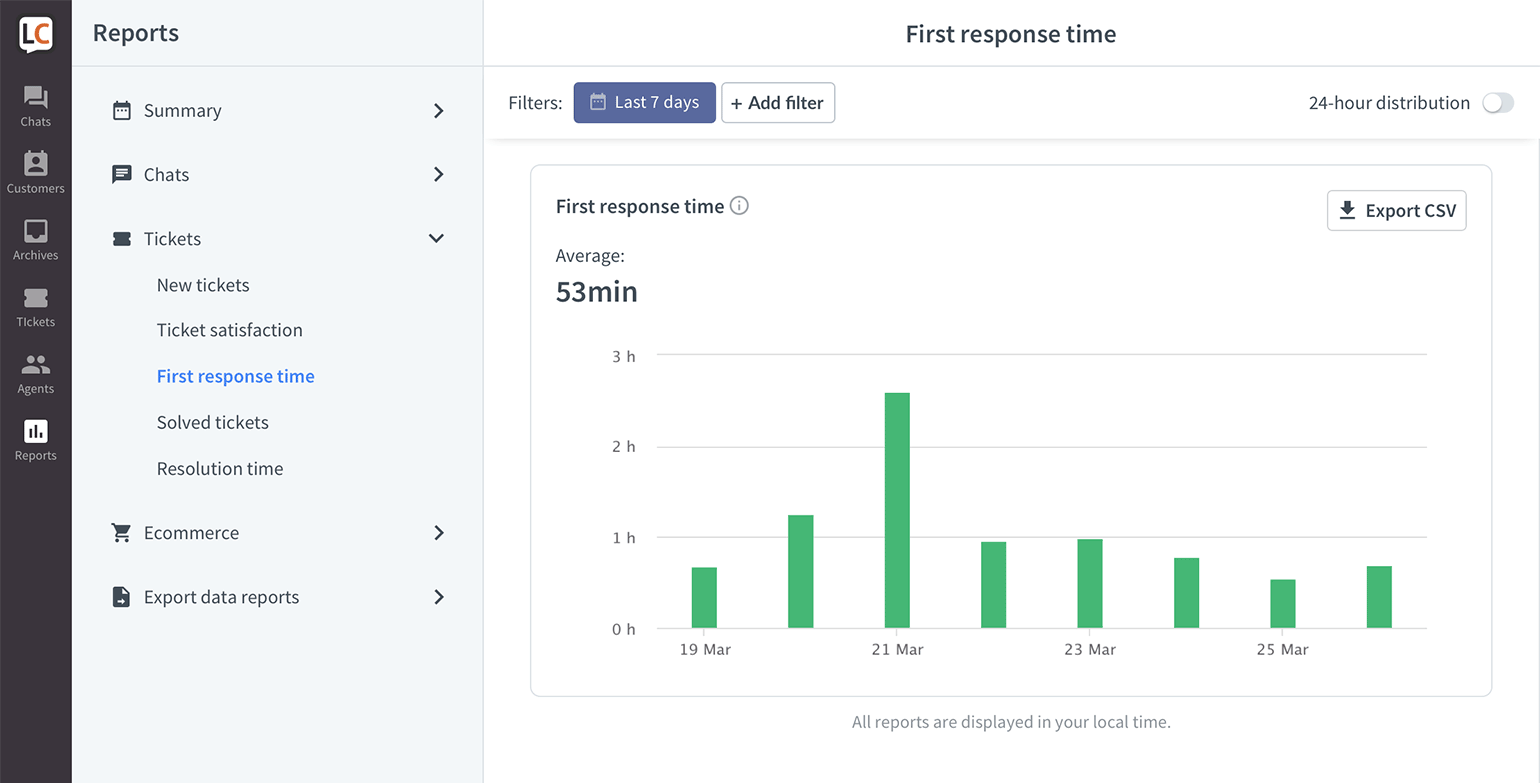
First response time report
This report shows you how quick your agents are to respond to new tickets. To provide you some background, the information about the total number of tickets answered that day is also available. The response time clock starts as soon as the ticket is created and stops when a reply to the ticket is posted.
Resolution time report
The data from this report tells you how long, on average, it takes for your agents to resolve a ticket. Just like in the case of the 'ticket first response' report, you can check the ticket resolution times for various groups and individual agents.
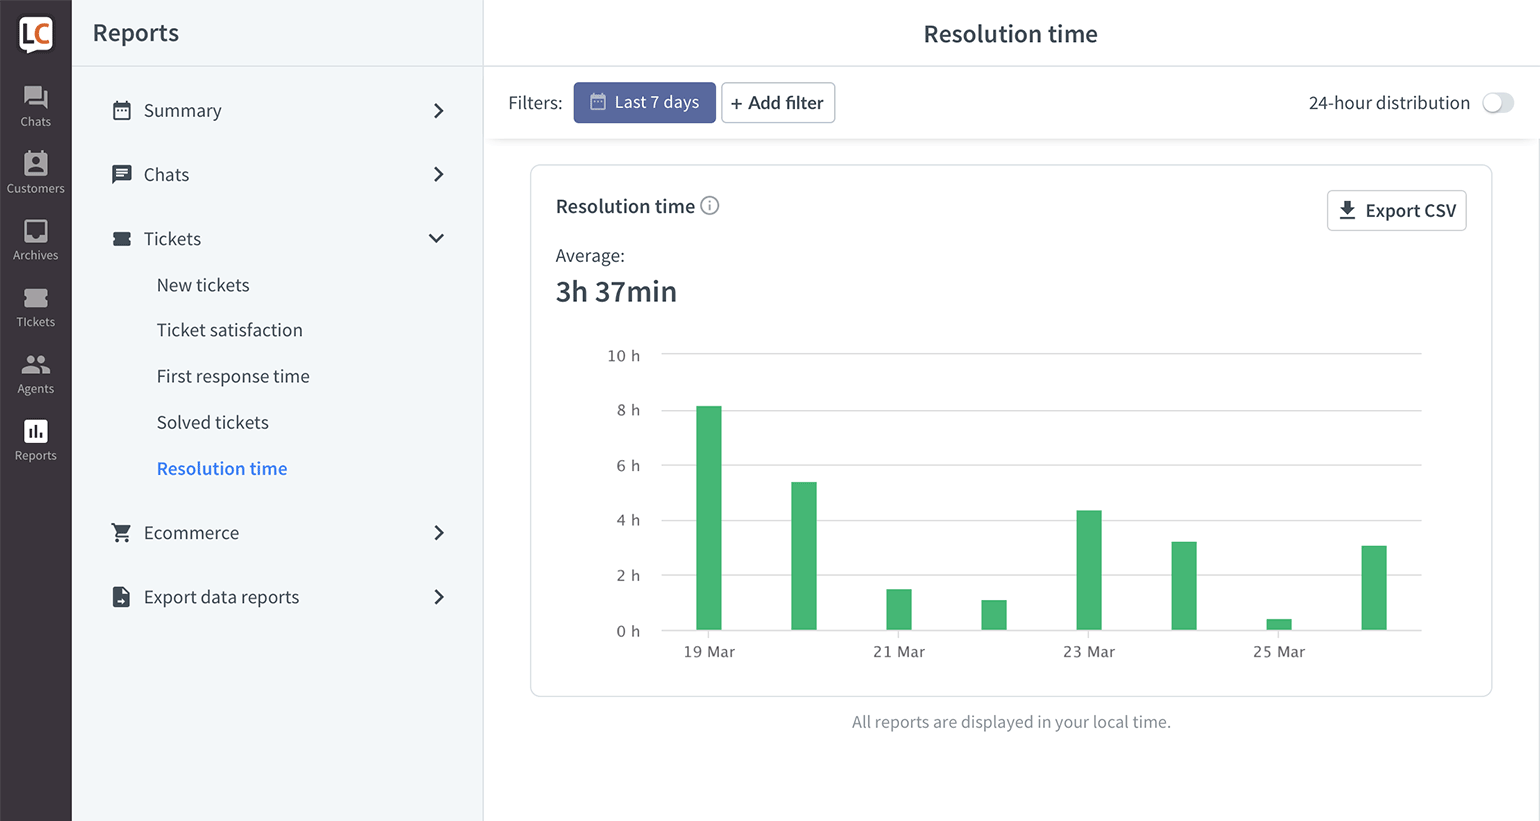
The resolution time is counted from the moment the ticket is created to the moment the ticket is marked as resolved.
Solved tickets report
Whether your team works according to KPI, SLA, or other pre-defined metrics, it makes sense to keep track of the number of tickets solved each day. It's important to resolve cases via tickets as soon as possible, as customers can quickly start feeling like you're ignoring them.
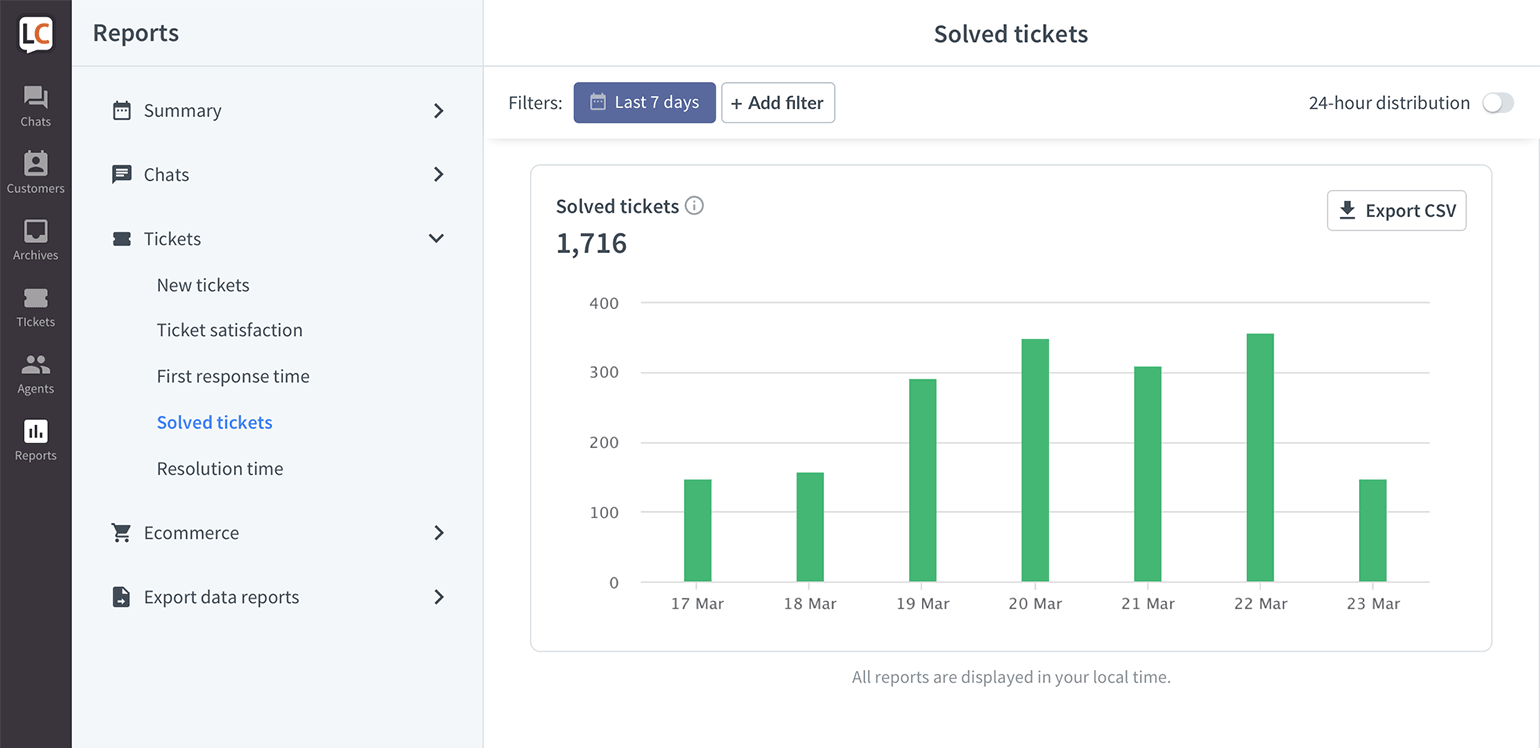
You can hover over a column to see a precise number of tickets solved that day. When you click on it, you will be taken to the Tickets section and be able to see and review all of them.